This post is an accompaniment to my Tracing, Fast and Slow talk at PyCon in Portland, OR in May 2017, EuroPython in Rimini, Italy in July 2017, and PyLadies in St. Petersburg, Russia in November 2018. Slides here and video from PyCon here.
If you’ve read the Site Reliability Engineering book from O’Reilly (a.k.a the “Google SRE book”), the TL;DR of many chapters seem to be “use distributed tracing.” With the not-that-new trend of microservices, where you may or may not own all the services that a request flow might touch, it’s imperative to understand where your code fits into the grand scheme of things, and how it operates.
There are three main needs for tracing a system: performance debugging, capacity planning, and problem diagnosis, although it can help address many others. While this post will have a slight focus on performance, these techniques can certainly be applicable for other needs.
NB: Before diving in, I want to make apparent that a lot of this is collated, paraphrased, and otherwise digested research from academic and white papers, including “So, you want to trace your distributed system” from Carnegie Mellon, “The Mystery Machine: End-to-end performance analysis of large-scale Internet services” by Facebook + University of Michigan, and Google’s “Dapper, a Large-Scale Distributed Systems Tracing Infrastructure”, among others.
Tracing Overview #
In the simplest terms, a trace follows the complete workflow from the start of a transaction (or request) to its end, including the components it flows through. For a very simple web application, it’s pretty easy to understand the workflow of a request. But add some databases, separate the frontend from the backend, throw in some caching, have an external API call, all behind a load balancer, then it gets difficult to put together workflows of requests.
Machine-centric #
Historically, we’ve been focused on machine-centric metrics, including system-level metrics like CPU, disk space, memory, as well as app-level metrics like requests per second, response latency, database writes, etc.1 Following and understanding these metrics are quite important, but there is no view into a service’s dependencies or its dependents. It’s also not possible to get a view of a complete flow of a request, nor develop an understanding about how one’s service performs at scale.
Workflow-centric #
A workflow-centric approach allows us to understand relationships of components within an entire system. We can follow a request from beginning to end to understand bottlenecks, hone in on anomalistic paths, and figure out where we need to add more resources.1
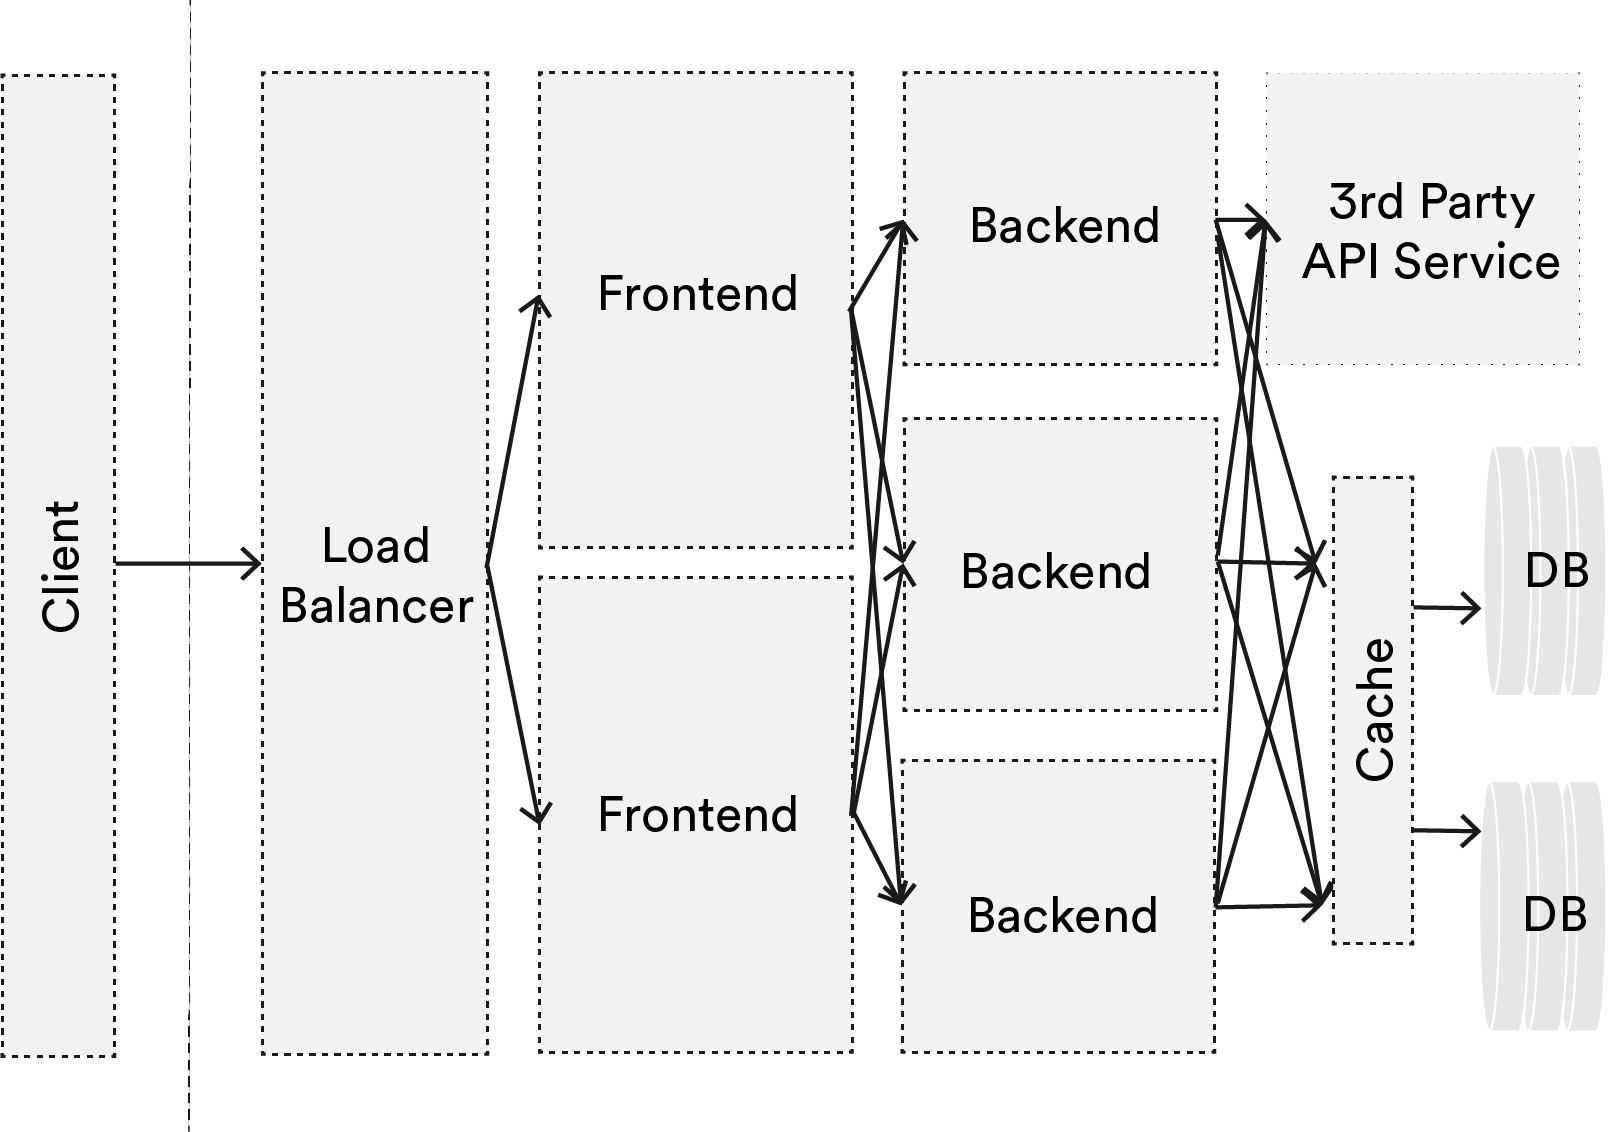
Looking at this super simplified system, where we have a load balancer, a frontend, backend, a database, and maybe an external dependency to a third-party API, then add redundancy, it can get particularly confusing to follow a request. How do we debug a problem of a rare workflow? How do we know which component of this system is the bottleneck? Which function call is taking the longest? Is another app on my host causing distortion to machine-centric performance metrics (noisy neighbors – a growing concern as many move to the cloud).
With so many potential paths that a request can take, with the potential for issues at every node and every edge, this can be mind-numbingly difficult if we continue to be machine-centric. End-to-end tracing will allow us to get a better picture to address these concerns.
Why Trace? #
Real briefly – there are many reasons to trace a system. The one that inspired this post is performance analysis; this is trying to understand what happens at the 50th or 75th percentile, the “steady state” problems. This will help identify latencies, resource and capacity usages, and other performance issues. We are also able to answer questions like: “did this particular deploy of this service have an effect on latency of the whole system?”
Tracing can also clue us on in anomalistic request flows – the 99.9 percentile. The issues can still be related to performance, or help identify problems with “correctness” like component failures or timeouts.
There is also profiling – very similar to the first – but here we’re just interested in particular components or aspects of the system. We don’t necessarily care about the full workflow.
Tracing can also answer the question of what a particular component depends on, and what depends on it; particularly useful for complex systems. With dependents identified, we can then attribute particularly expensive work (e.g. component A adds significant workload with disk writes to component B), which can be helpful when attributing cost to teams/service owners/component owners (e.g. component A forces component B to spend more $$ in AWS/GCP/etc). 2
And finally, we’re able to create models of our systems that allow us to ask what-if questions, like “what would happen to component A if we did a disaster recovery test on component B?”
Approaches to Tracing #
Manual #
There are simple things that can be added to a web service, especially one that does not have dependent/depending components that you don’t own/have access to. You won’t get any pretty visualizations or help with centralized collection beyond how you typically handle your logs, but it still can provide a lot of insight.
So this is an example flask route and a decorator:
# app.py - create a unique request ID for every request
import uuid
from functools import wraps

from flask import Flask

app = Flask(__name__)


def request_id(f):
    @wraps(f)
    def decorated(*args, **kwargs):
        req_id = uuid.uuid4()
        return f(req_id, *args, **kwargs)
    return decorated


@app.route("/")
@request_id
def index(req_id):
    # log w/ ID for wherever you want to trace
    # app logic
Here, you can simply add a UUID to each request received as a header, then log at particular points of interest, like the beginning and end of handling a request, and any other in-between component or function calls, and propagate those headers if you can.
If your app is behind an nginx installation that you’re able to manipulate, you can turn on its ability to stamp each request with an X-Request-ID header which can be used in your app:
# /etc/nginx/sites-available/app

upstream appserver {
    10.0.0.0:80;
}

server {
    listen 80;
    # Returns header to client - useful for depending services
    add_header X-Request-ID $request_id;
    location / {
        proxy_pass http://appserver;
        # Passes header to the app server
        proxy_set_header X-Request-ID $request_id;
    }
}
# app.py - get X-Request-ID header from nginx
from functools import wraps

from flask import Flask

app = Flask(__name__)


def request_id(f):
    @wraps(f)
    def decorated(*args, **kwargs):
        # get the request ID header passed through from nginx
        req_id = request.headers.get("X-Request-ID")
        return f(req_id, *args, **kwargs)
    return decorated


@app.route("/")
@request_id
def index(req_id):
    # log w/ ID for wherever you want to trace
    # app logic
You can also very simply add that request ID to nginx’s logs:
# /etc/nginx/sites-available/app - logging to access_trace.log file

log_format trace '$remote_addr - $remote_user [$time_local] "$request" '
                 '$status $body_bytes_sent "$http_referer" "$http_user_agent" '
                 '"$http_x_forwarded_for" $request_id';

upstream appserver {
    10.0.0.0:80;
}

server {
    listen 80;
    add_header X-Request-ID $request_id;
    location / {
        proxy_pass http://appserver;
        proxy_set_header X-Request-ID $request_id;
        # Log $request_id
        access_log /var/log/nginx/access_trace.log trace;
    }
}
Blackbox #
Blackbox tracing is tracing with no instrumentation across the components. It tries to infer workflows and relationships by correlating variables and timing within already-defined log messages. From there, relationship inference is done via statistical or regression analysis.
It’s easiest with centralized logging, and if there is a somewhat standardized schema to log messages that contain some sort of ID and timestamp.3 It’s particularly useful if instrumenting an entire system is too cumbersome (e.g. too much coordination with engineers) or can’t otherwise instrument components you don’t own. As such, it’s quite portable and is very little-to-no overhead, but it does require a lot of data points in order to infer relationships. It also lacks accuracy with the absence of instrumenting components themselves, as well as the ability to attribute causality with asynchronous behavior and concurrency.
Facebook and the University of Michigan wrote a very readable academic paper on assessing end-to-end performance employing this method.
Another approach to blackbox tracing can be through network tapping with the use of Sflow, nfdump, and iptable packet data. Which I’m sure the NSA very familiar with themselves < cough >.
Metadata Propagation #
The final common type of tracing is through metadata propagation. It’s the approach that was made popular by Google’s research paper on Dapper.
Essentially, components are instrumented at particular trace points to follow causality between functions, components, and systems; or even with common RPC libraries that will automatically add metadata to each call.
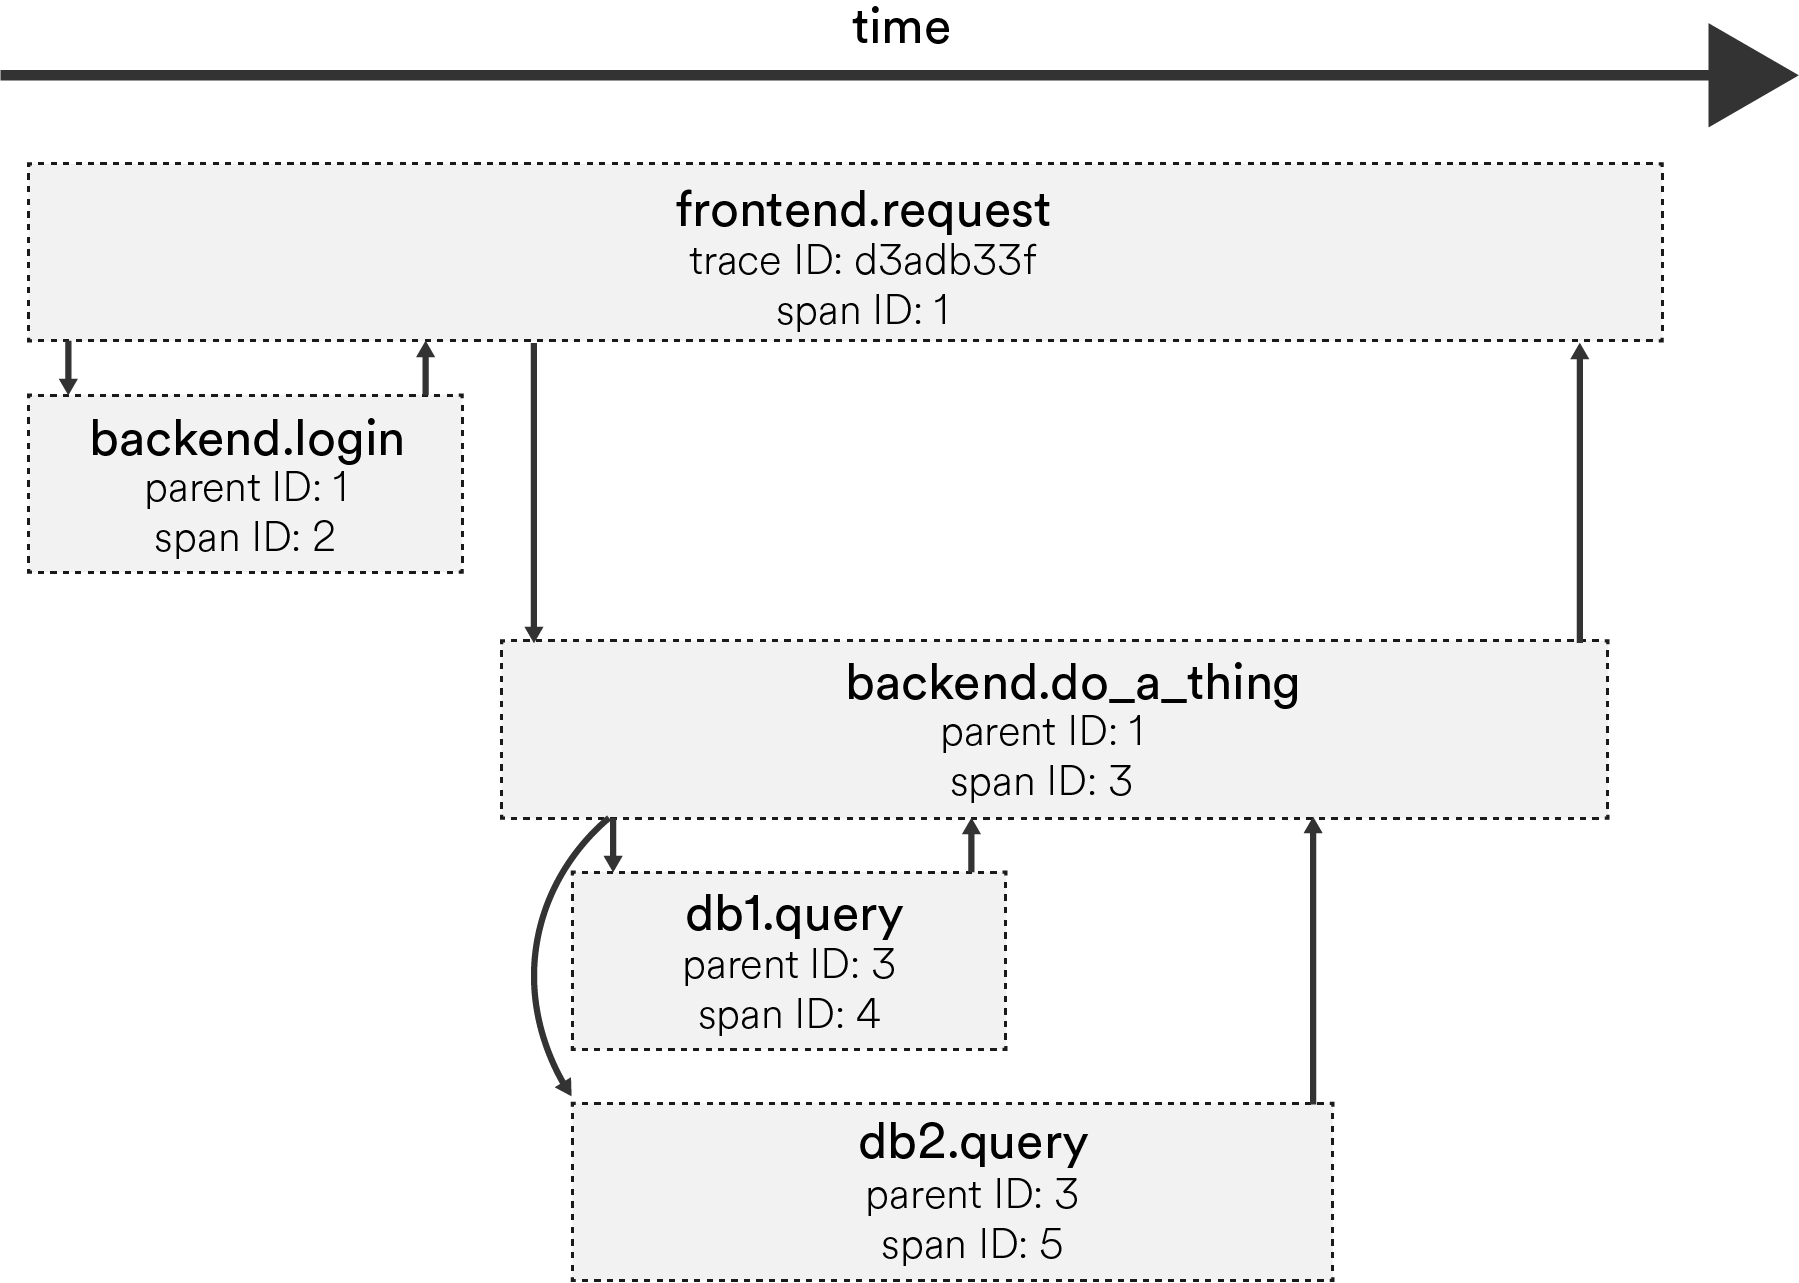
Metadata that is tracked includes a trace ID – which represents one single trace or work flow – and a span ID for every point in a particular trace (e.g. request sent from client, request received by server, server responds, etc.) plus a span’s start and end time.
This approach is best when the system itself is designed with tracing in mind (but who actually does that!?) and avoids the guesswork with inferring causal relationships. However, it can add a bit of overhead to response time and throughput, so the use of sampling traces limits the burden on the system and data point storage. Sampling as low as 0.01% requests is plenty to get an understanding of a system’s performance.4
Tracing at Scale #
When starting to have many microservices, and scale out with more resources, there are a few points in mind when instrumenting your system, particularly with the metadata propagation approach:
- What relationships to track: essentially how to follow a trace and what is considered part of the workflow.
- How to track them: constructing metadata to track causal relationships is particularly difficult; there are a few approaches, each with their own fortés and drawbacks.
- How to sample and reduce overhead of tracking: the approach one chooses in sampling is largely defined by what questions you’re trying to answer with your tracing; there may be a clear answer, but not without penalties.
- What to visualize: The visualizations needed will also be informed by what we’re trying to answer with tracing.
What relationships to track #
When looking within a request, we can take two points of views: either the submitter PoV, or the Trigger.5
The submitter follows or focuses on one complete request, and doesn’t take into account if part of that request is caused by another request/action.
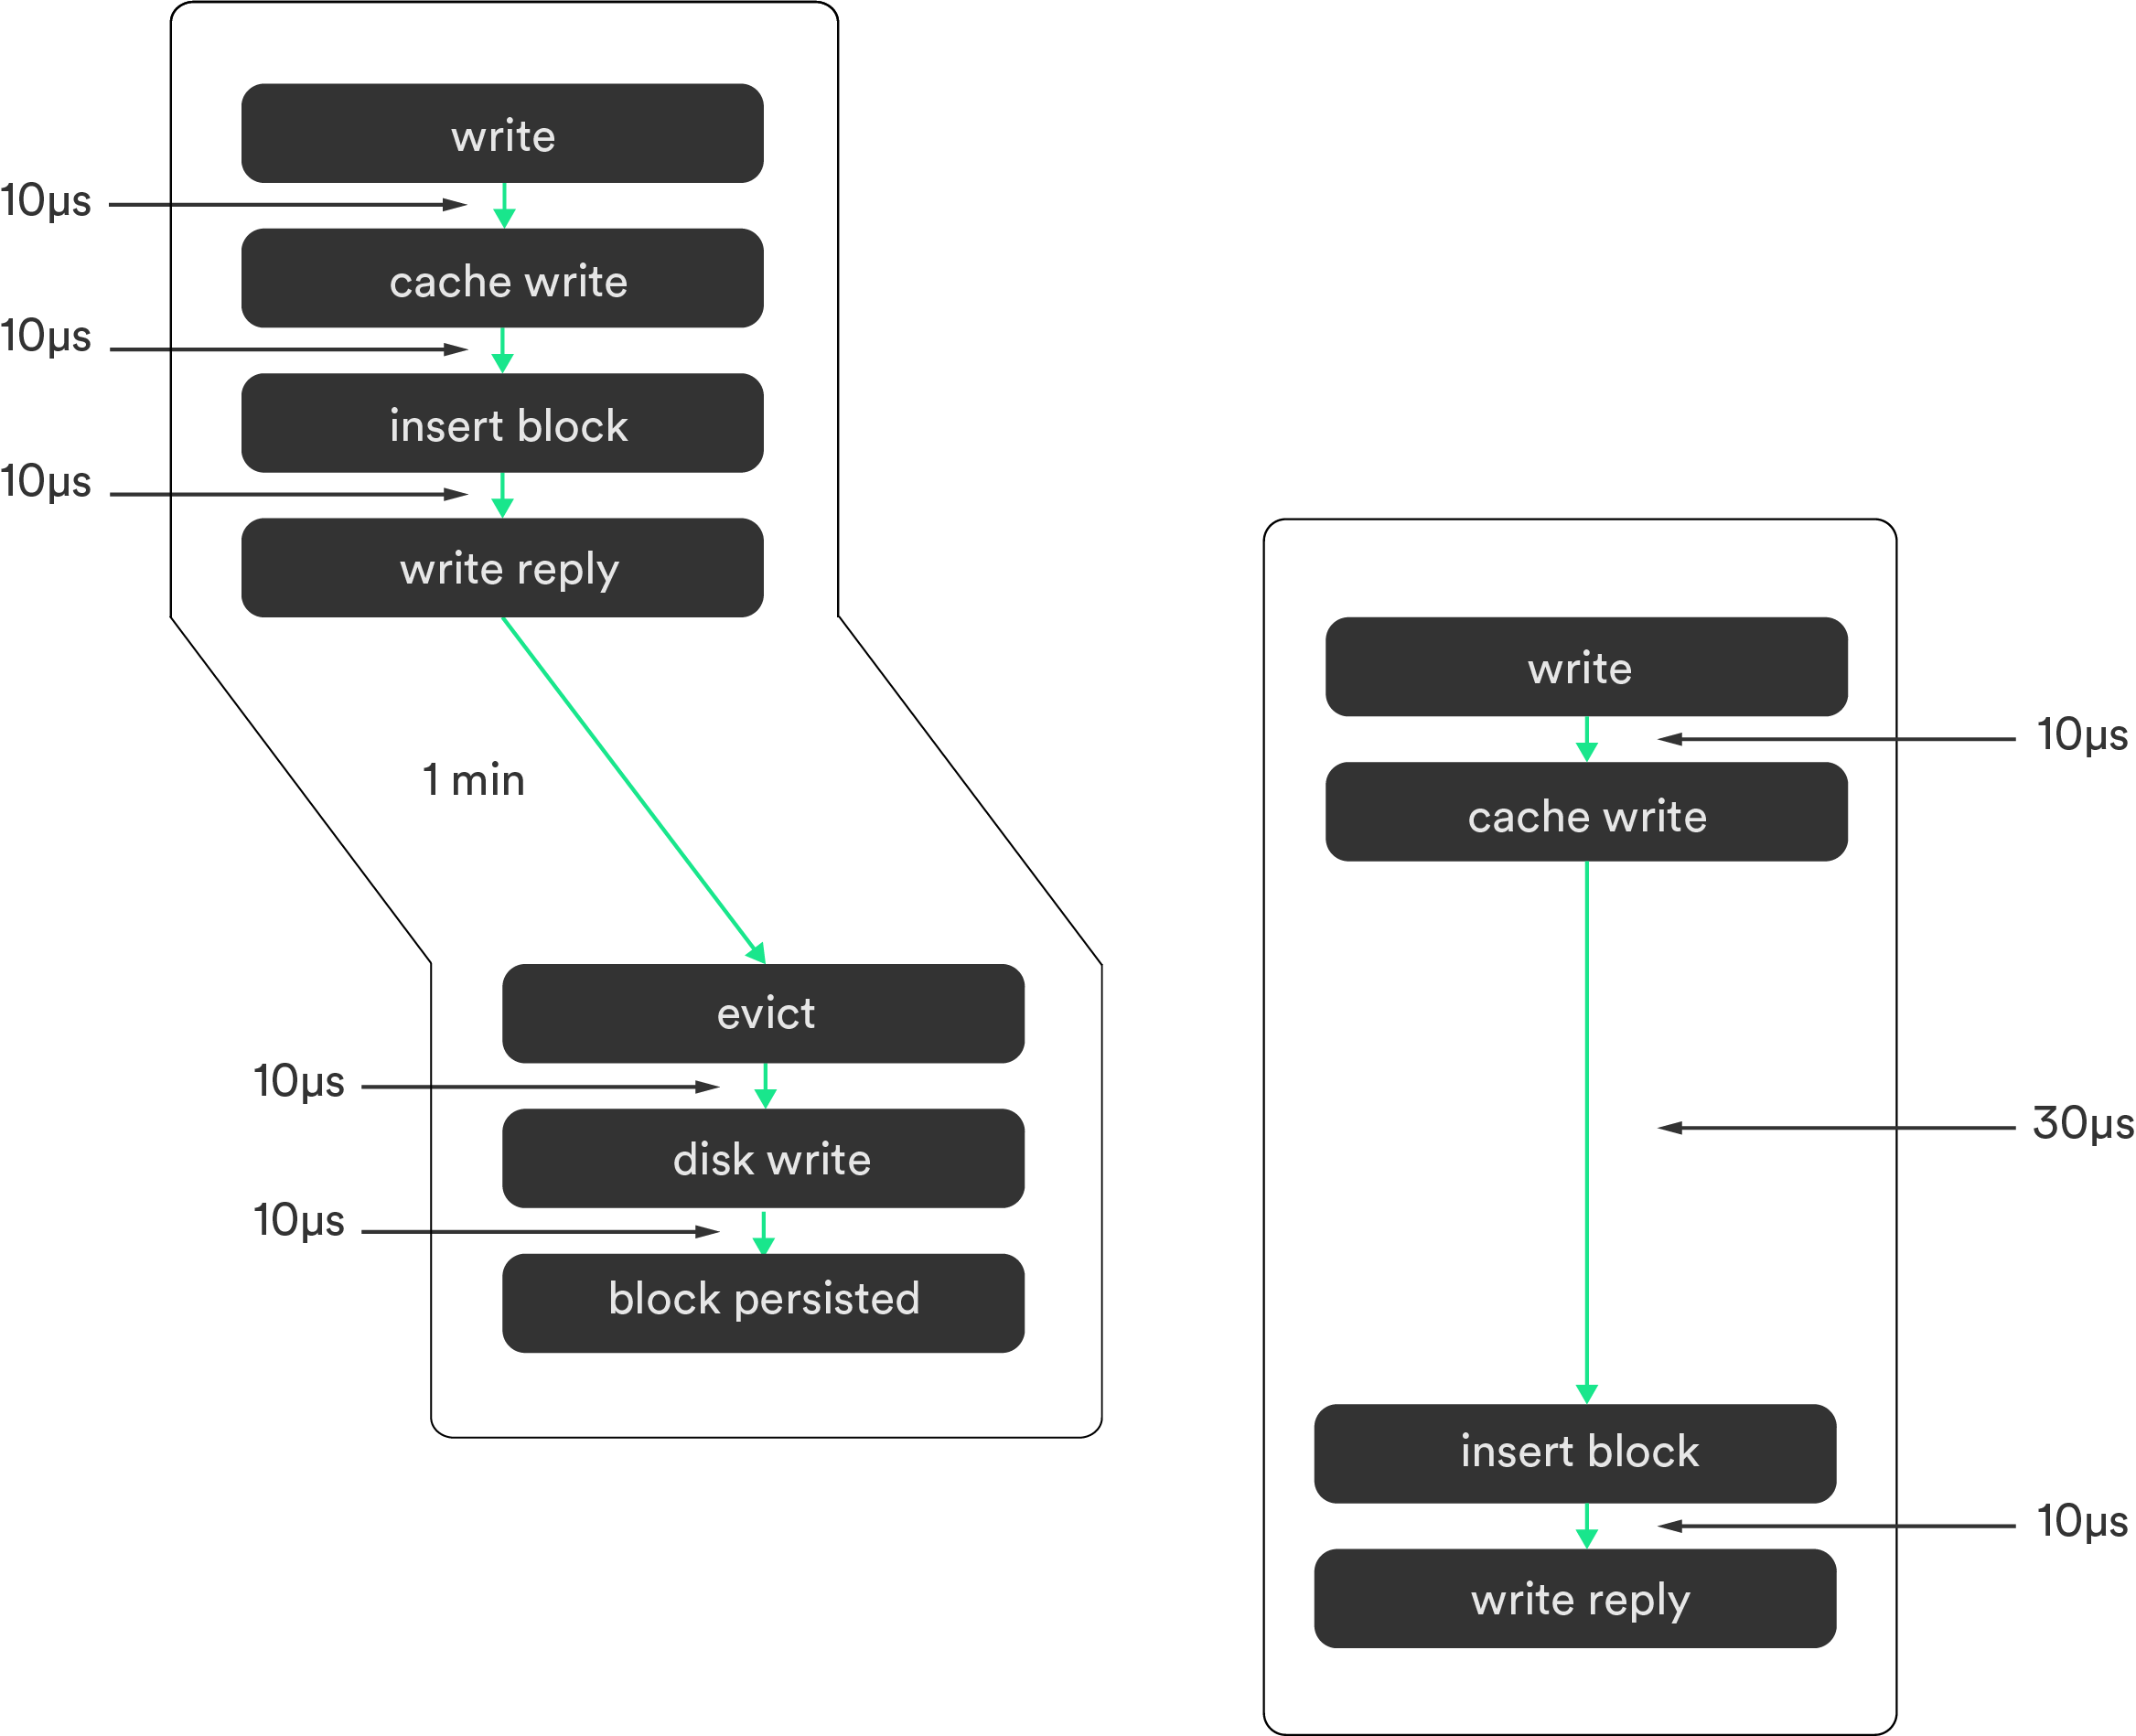
For instance, evicting cache that was actually triggered by request #2 is still attributed to request #1 since its data comes from #1.
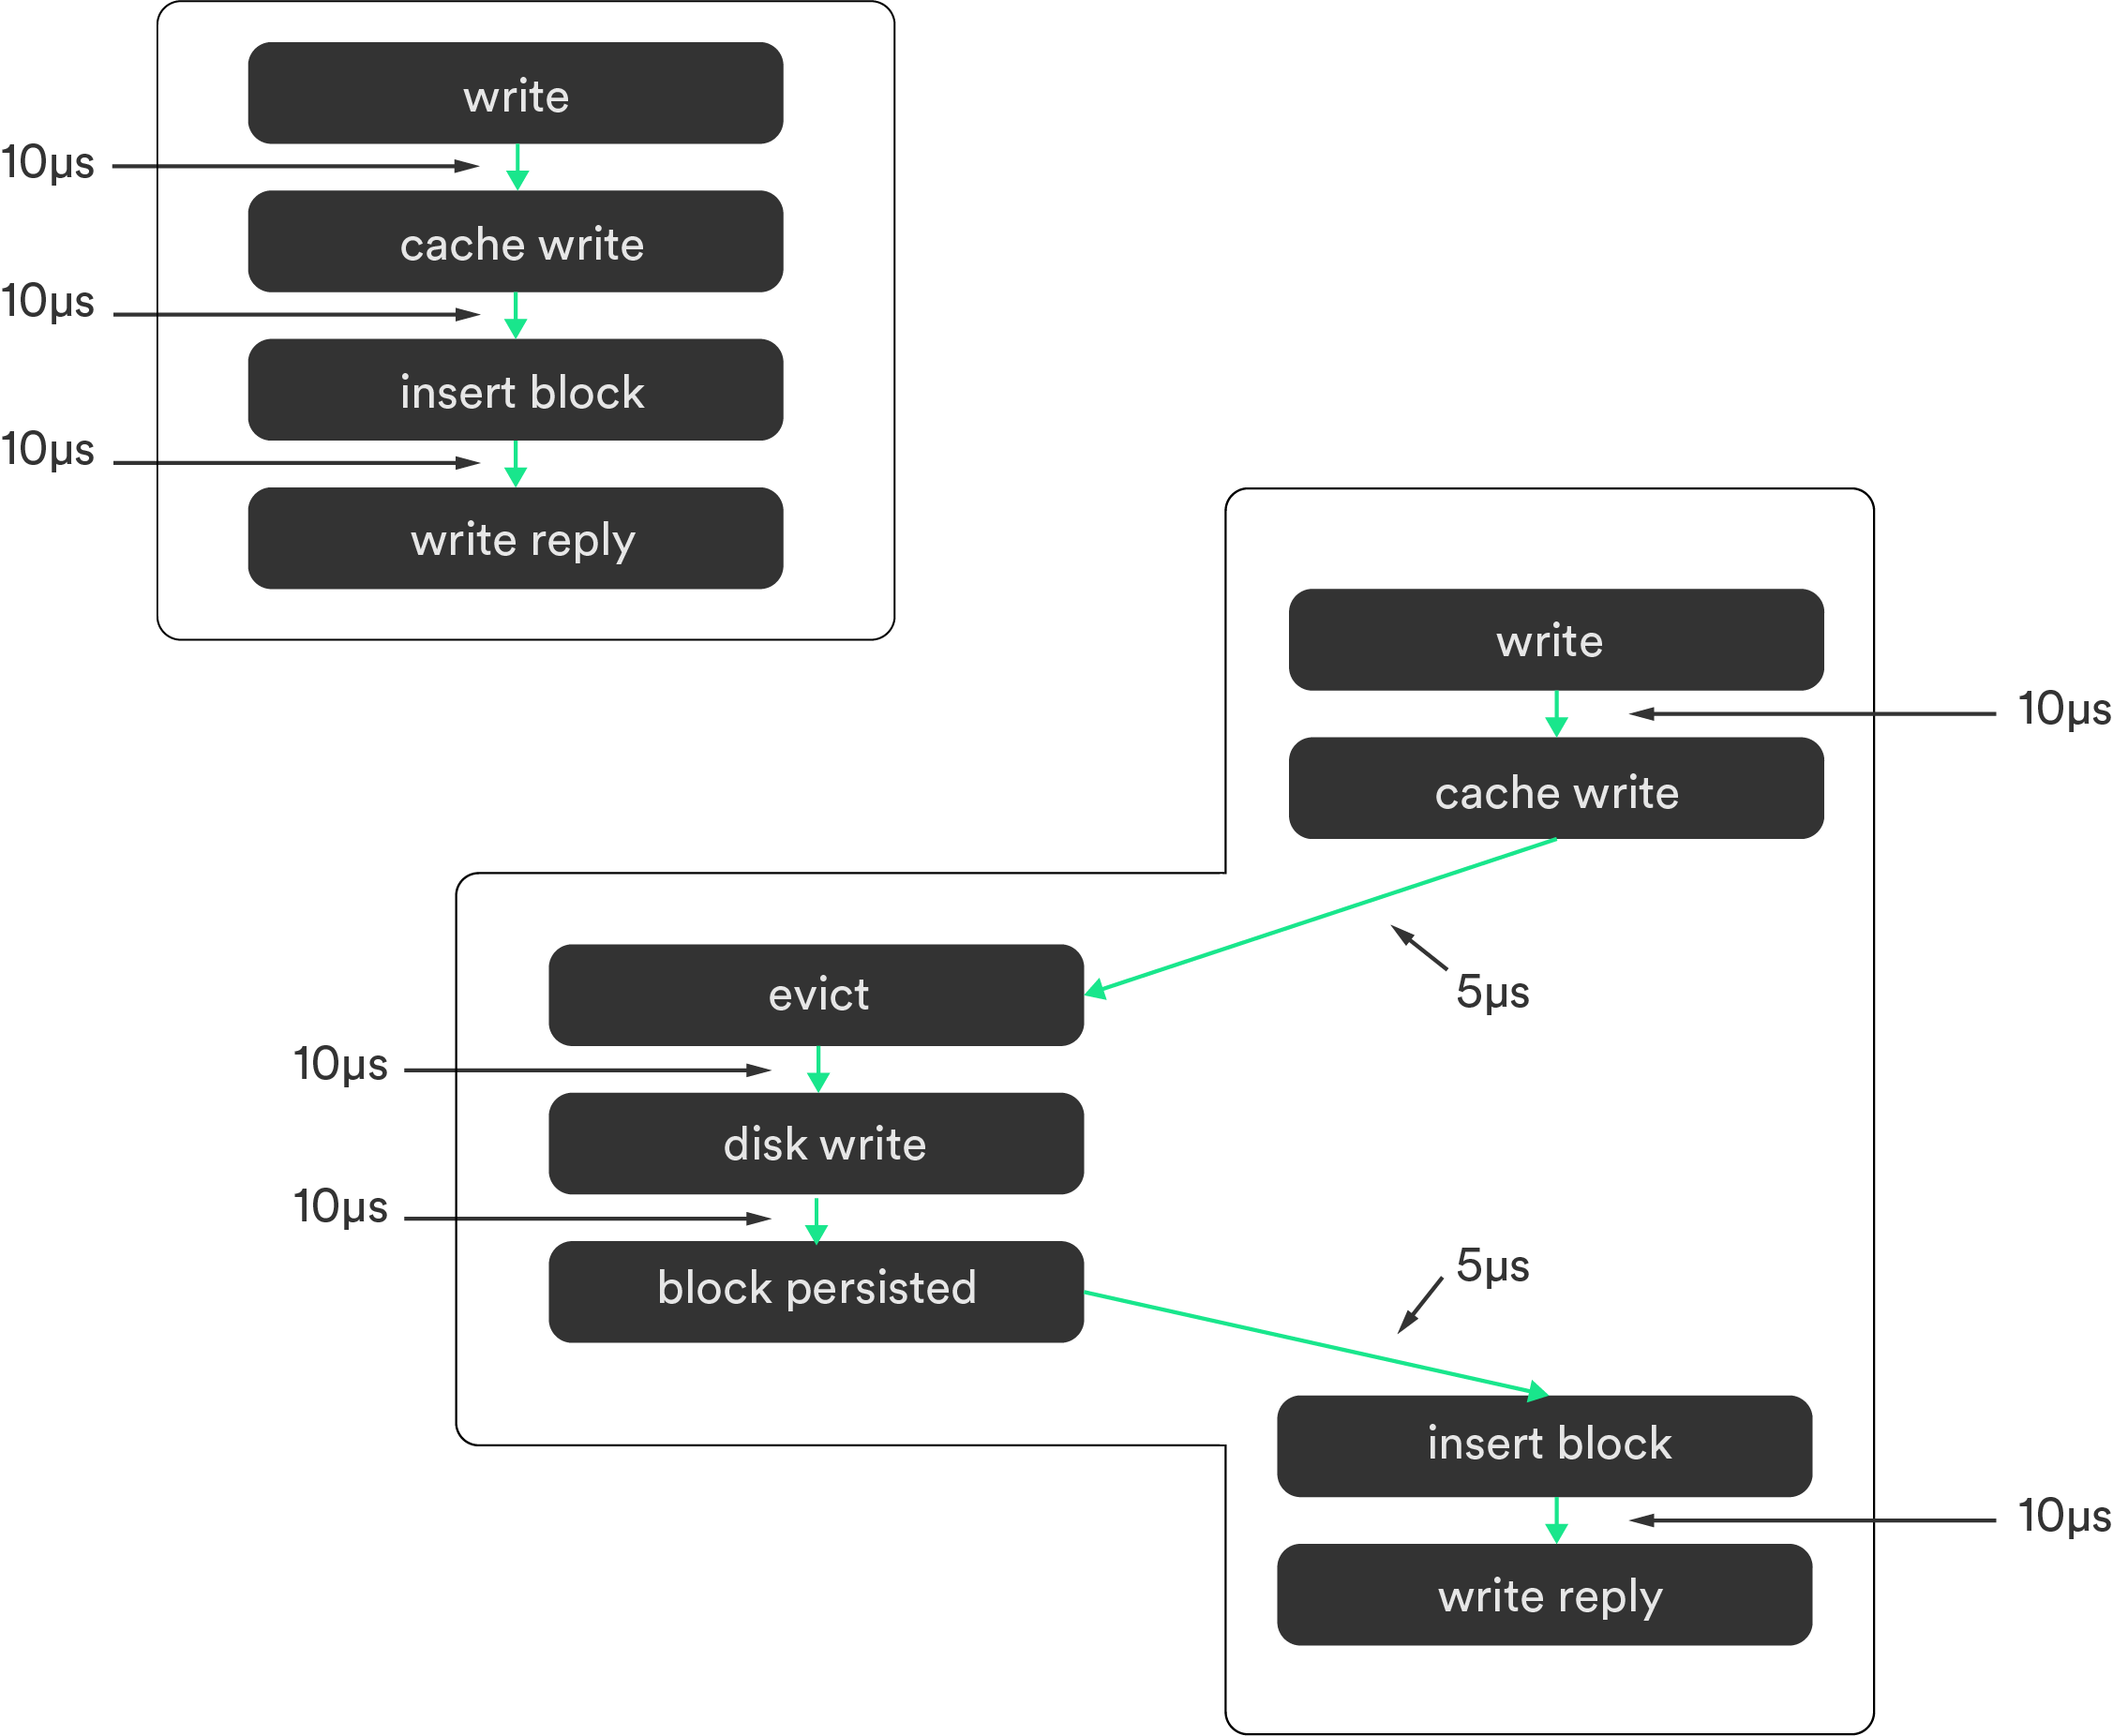
The trigger PoV focuses on the trigger that initiates action. Where in the same example, request #2 evicts cache from request #1, and therefore the eviction is included in request #2’s trace.
Choosing which flow to follow depends on the answers you’re trying to find. For instance, it doesn’t matter which approach is chosen for performance profiling, but following trigger causality will help detect anomalies by showing critical paths.
How to track relationships #
…or what essentially is needed in your metadata.
What this boils down to is that it can be difficult to reliably track causal relationships within a distributed system. The sheer nature of a distributed system implies issues with ordering events and traces that happen across many hosts. There may not be a global synchronous clock available, so care must be taken in deciding what goes into crafting the metadata that is threaded through an end-to-end trace.
Request ID #
Using a random ID like UUID or the X-Request-ID header will identify causally-related activity. But then tracing implementations must then use an external clock to collate traces.
In the absence of a global synced clock, or to avoid issues such as clock skew, looking at network send and receive messages can then be used to construct causal relationships (you can’t exactly receive a message before its sent).6
However, this approach lacks in resiliency as there is potential for data loss from external systems, or inability to add trace points in components owned by others.
Request ID + Logical Clock #
Tracing systems can also add a timestamp derived from a local, logical clock to the workflow ID, where it isn’t exactly the local system’s timestamp, but either a counter or sort of a randomized timestamp that is paired with the trace message as it flows through components.6 With this approach, we don’t need the tracing system to spend time on the ordering of traces it collects since its explicit in the clock data, but parallelization and concurrency can complicate the understanding of relationships.
Request ID + Logical Clock + Previous Trace Points #
One can also add the previous trace points that have been executed within the metadata to understand all the forks and joins. It also allows the immediate availability of tracing data as soon as the workflow ends, as there is no need to spend time on trying to establish the ordering of causal relationships.7 But, as you can imagine, the metadata will only grow in size as it follows a workflow, adding to the payload.
Trade-offs #
The above three approaches have trade-offs: payload size vs. explicit relationships vs. resiliency to lost data vs. immediate availability.
If you really care about the payload of the request, then a simple unique ID is your go-to, but at the expense of needing to infer relationships. Adding a timestamp of sorts can help establish explicit causal relationships, but you’re still susceptible to potential ordering issues of traces if data is lost. You may add the previously-executed tracepoints to avoid data loss and understand the forks and joins of a trace, while gaining immediate availability since the causal relationships are already established. But then you suffer in payload size. And – to my knowledge – there’s also the fact that no open source tracing systems implement this.
How to sample #
End-to-end tracing will have an effect on runtime and storage overhead no matter what you choose. For instance, if Google were to trace all web searches, despite its intelligent tracing implementation – Dapper – it would impose a 1.5% throughput penalty and add 16% to response time.8
I won’t go into detail, but there are essentially three basic approaches to sampling:
- Head-based: a random sampling decision is made at the start of a workflow, and then follow it all the way through completion.9
- Tail-based: the sampling decision is made at the end of a workflow, implying some caching going on. Tail-based sampling needs to be a bit more intelligent, but is particularly useful for tracing anomalistic behavior.10
- Unitary: the sampling decision is made at the trace point itself (and therefore prevents the construction of a full workflow).10
Head-based is the simplest and ideal for performance profiling, and both head based and unitary are most often seen in current tracing system implementations. I’m not sure if there’s an open source tracing system that implements tail-based sampling.
What to visualize #
What visualization you choose to look at depends on what you’re trying to figure out.
Gantt Charts #
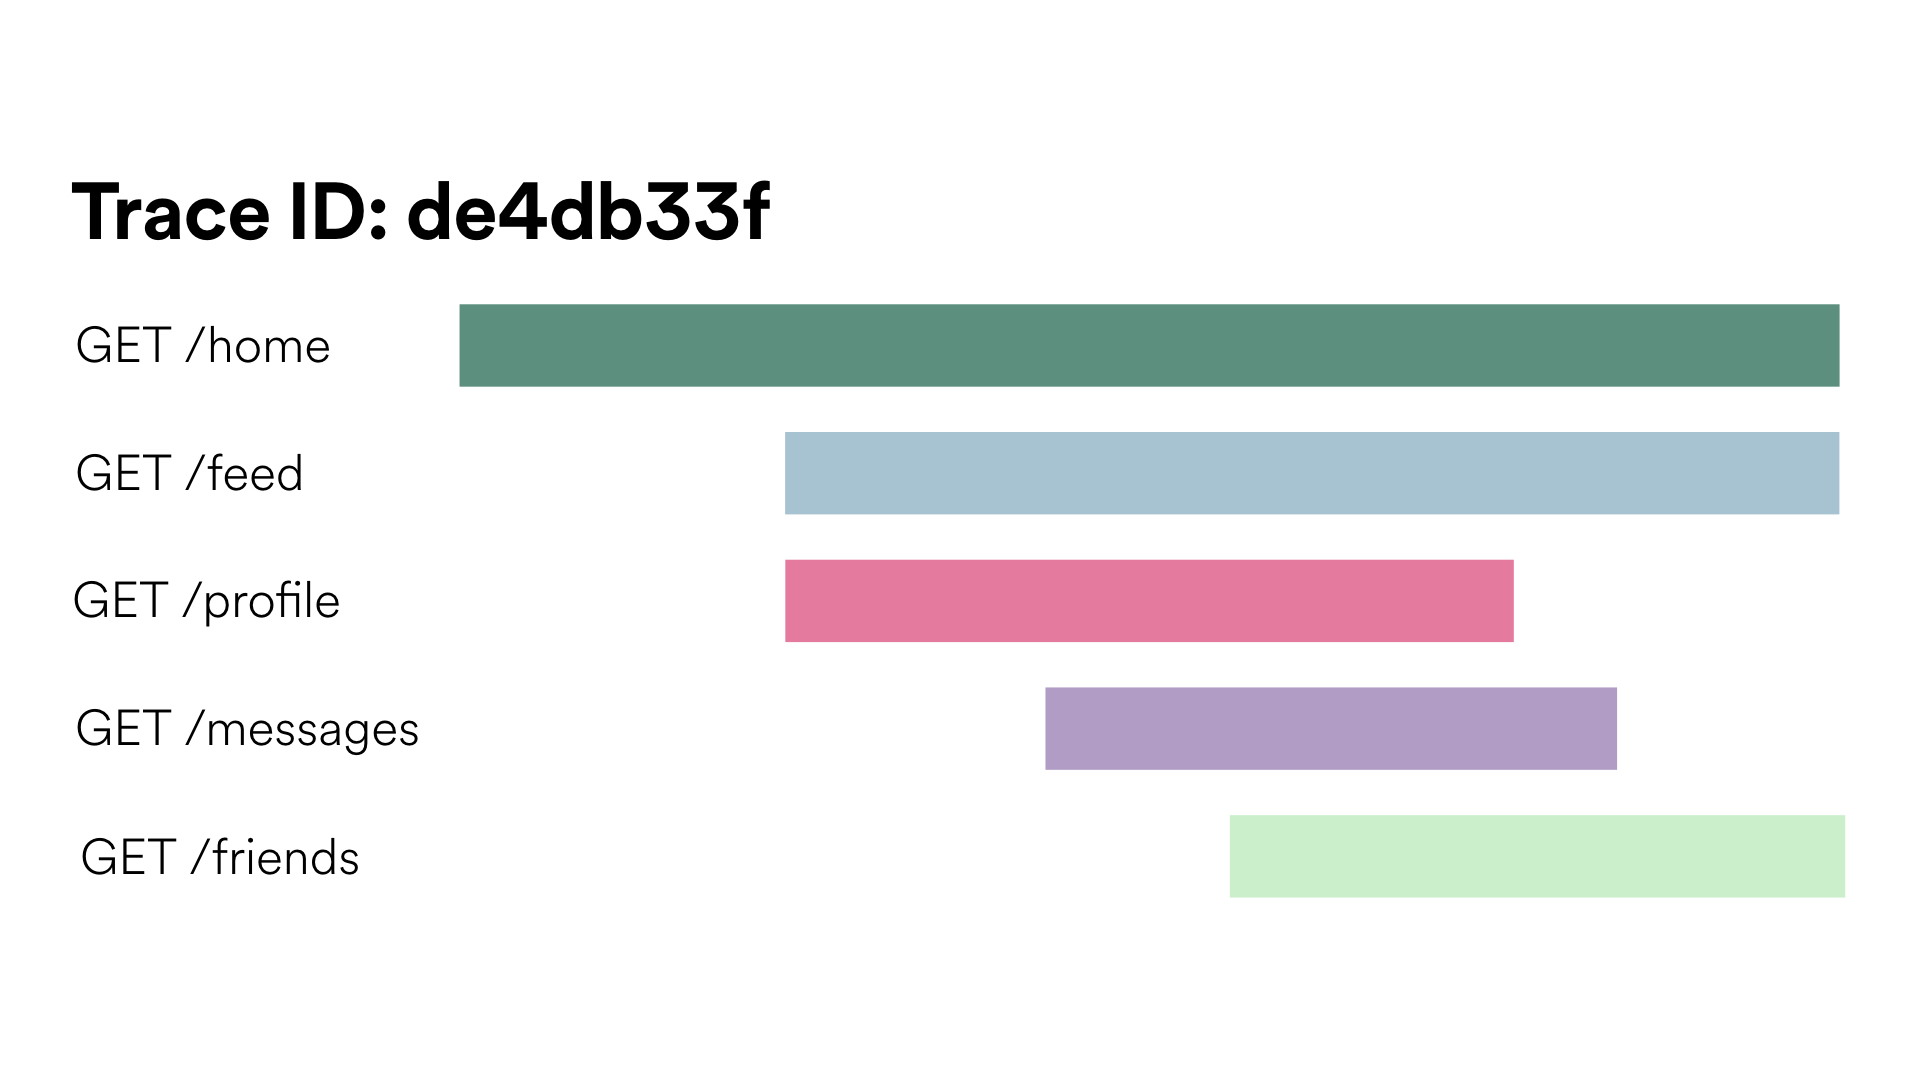
Gantt charts are popular and definitely appealing, but only show requests from a single trace. You’ve definitely seen this type if you’ve looked at the network tab of your browser’s dev tools. Nearly all open source tracing tools provide this type of chart.
Request Flow Graph #
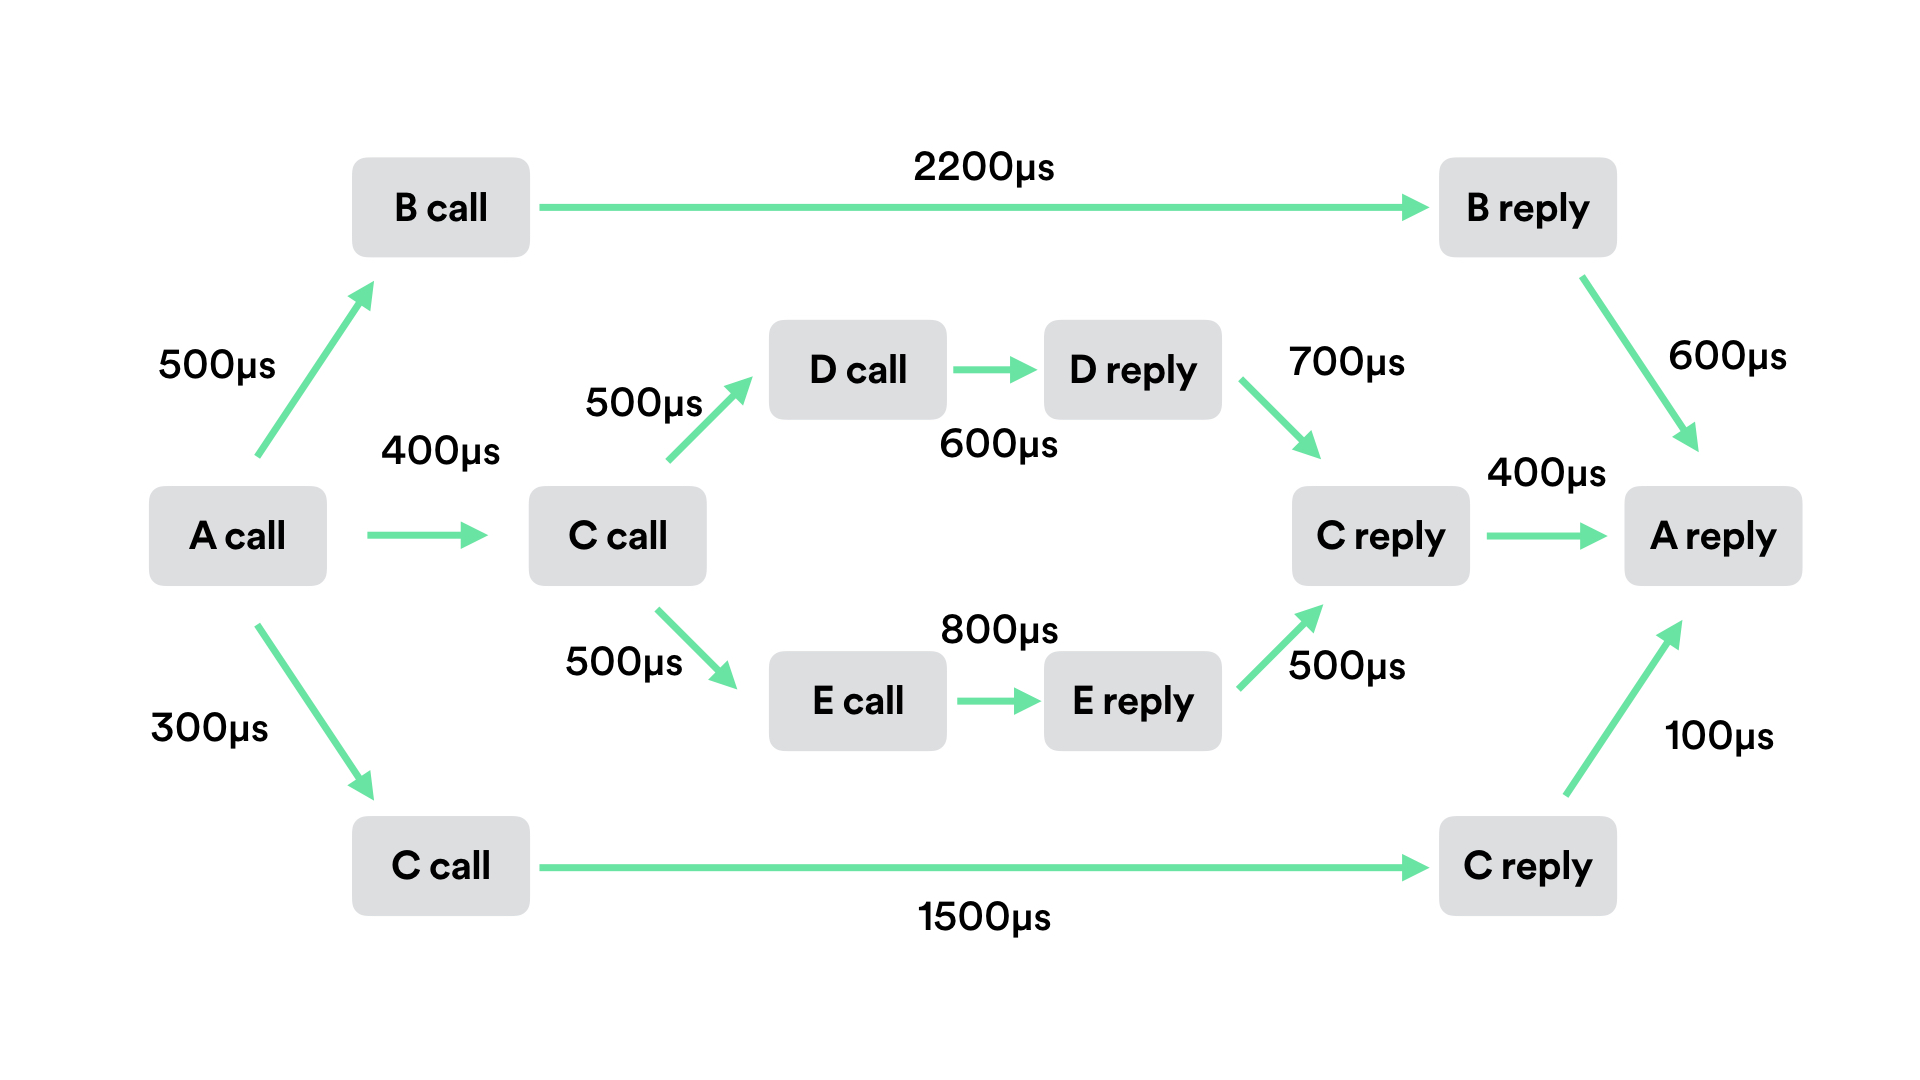
When trying to get a sense of where a system’s bottlenecks are, a request flow graph (a.k.a. directed-acyclic graph) will show workflows as they are executed, and – unlike Gantt charts – can aggregate information of multiple requests of the same workflow.
Context Calling Tree #
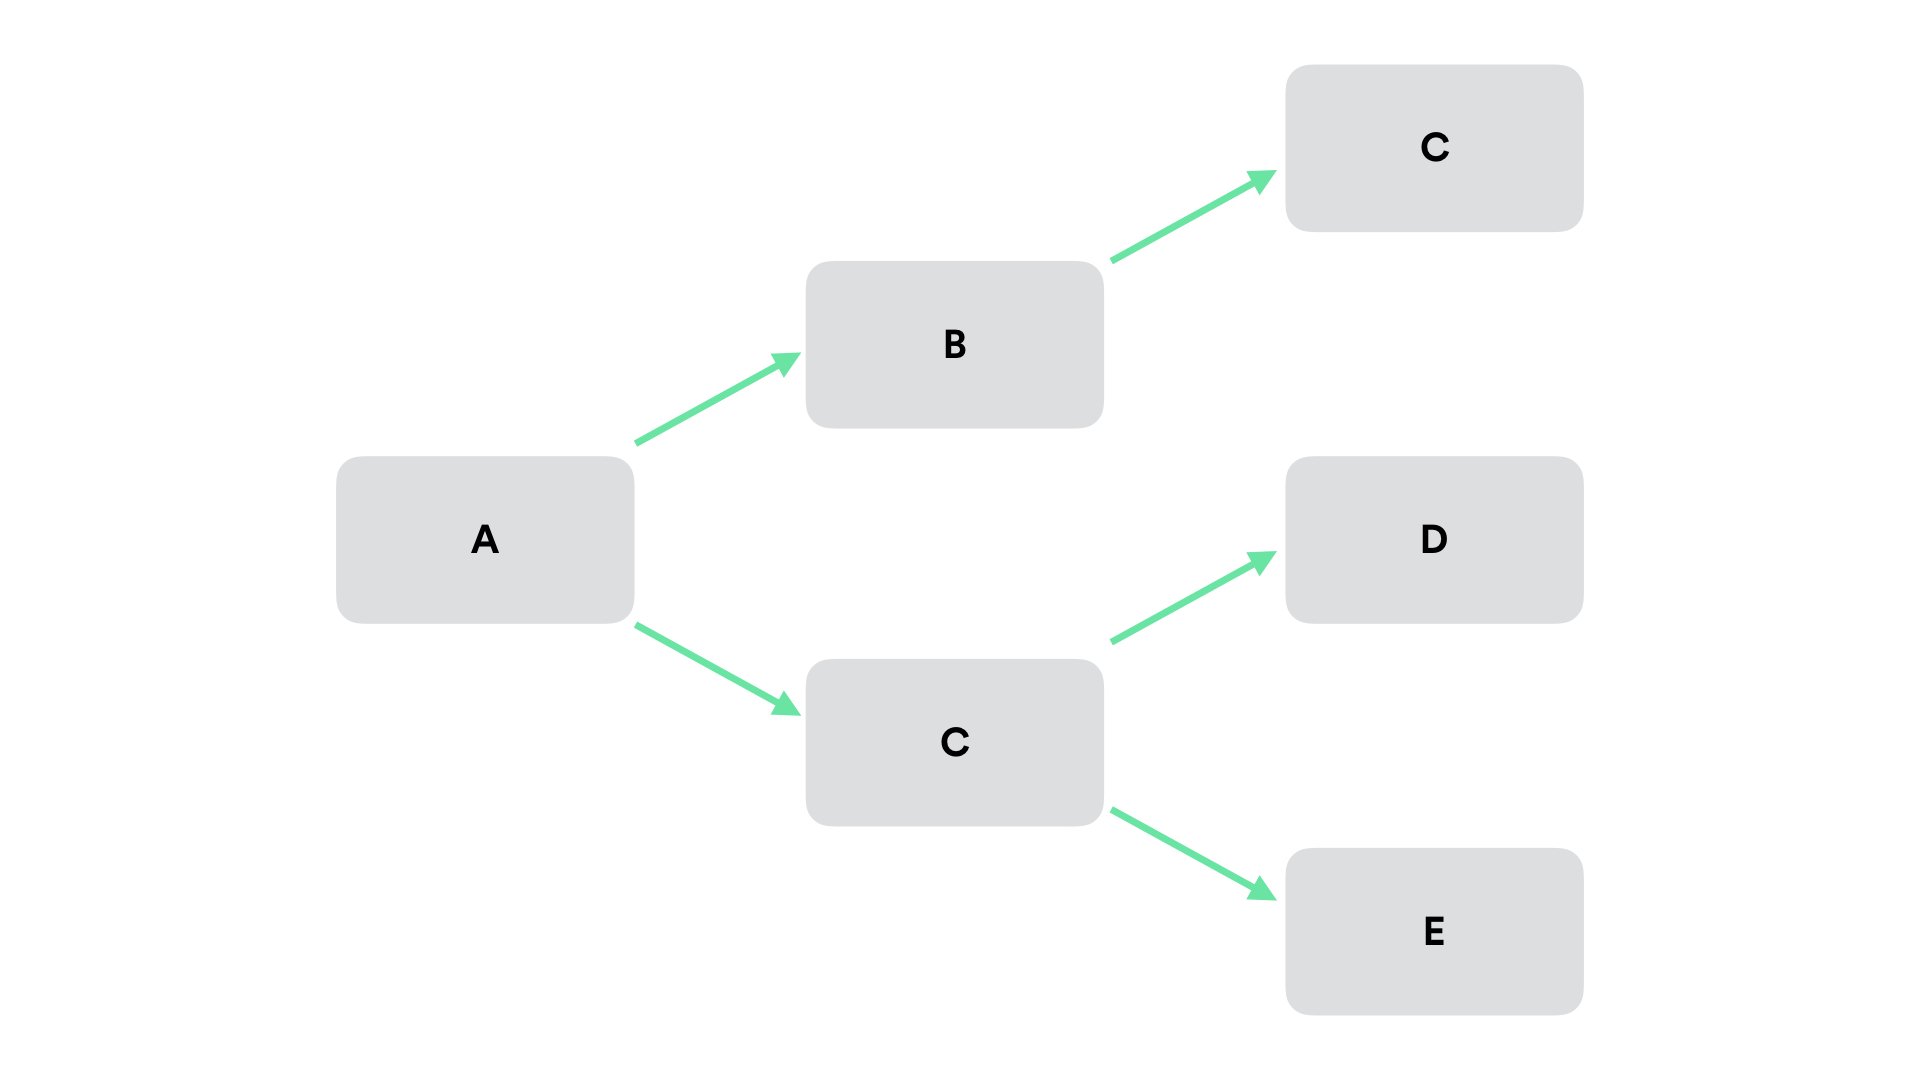
Another useful representation is a calling context tree in order to visualize multiple requests of different workflows. This reveals valid (and invalid) paths requests can take, best for creating a general understanding of system behavior.
Keep in mind #
What the take away here is there’s a few things we need to consider when we trace a system:
What do I want to know? #
You should have an understanding of what you want to do. What questions are you trying to answer with tracing?
Certainly, there may be other realizations and questions that come from tracing – for example, with Dapper, Google is able to audit systems for security, asserting only authorized components are talking to sensitive services11 – but without understanding what you’re trying to figure out, you may end up approaching your instrumenting incorrectly.
The answer to this question will help identify how to approach the causality – whether from the Trigger point of view, or submitter.
How much can I instrument? #
Another important question: how much time can you put into instrumenting your system? Or can you even instrument all parts? This will inform the approach you can use to tracing, be it blackbox or not. If you can instrument all the components, it then becomes a question of what data should you propagate through an entire flow.
How much do I want to know? #
And finally, how much of the flows do you want to understand? Do you want to understand all requests? Then be prepared to take a performance penalty on the service itself. And have fun storing all that data.
Is a percentage of flows okay? If so, then how to approach sampling is in your answer to the “what do I want to know” question. So for understanding performance, head based sampling is just fine.
You’ll also need to think about whether or not you want to capture the full flow of the request, of if you want to focus on a subset of the system. This will also affect your sampling approach.
Approach for performance analysis #
With performance or steady-state problems, you’ll want to try and preserve the trigger causality rather than submitter as it shows the critical path to that bottleneck. Head-based sampling is fine as we don’t need intelligent sampling, and even with low sampling rates, we’re able to get a good idea of where our problem lies. And finally, a request flow graph here is ideal since we don’t care about anomalistic behavior. We want information of the big picture rather than looking into particular, individual workflows.
Improving performance: #
Questions to ask yourself #
Most often, once you’re tracing a system, the problem will reveal itself, as will the solution. But not always, so I have a few questions to ask yourself with figuring out how to improve a service’s performance. Of course, this isn’t an exhaustive list; it’s just to get you thinking.
Batching Requests #
Are you making multiple requests to the same service? Round trip network calls are expensive; perhaps there’s a way to batch requests. Some helpful libraries: django-batch-requests (looks like limited to explicit v2.7 support, may work with 3.x), flask snippet, and a few pyramid approaches.
Server Choice #
Can you make the switch from an Apache HTTP server to nginx? A simple switch may provide a boost, especially under heavy load.
Parallelization #
Are there any parallelization opportunities? Perhaps your service doesn’t need to be synchronous or it unnecessarily blocks. For example, if you’re some big social network site, can you grab a user’s profile photo at the same time as you pull up their timeline, while getting their messages?
Caching #
Is it useful to add (or fix) caching? Is the same data being repeatedly requested but not cached? Or are you caching too much? or not the right data? Is the expiration too high or low?
Asset Handling #
What about your site’s frontend assets: could they be ordered better to improve loading time? Can you minimize the amount of inline scripts? Maybe make your scripts async? Are there a lot of distinct domain lookups that adds time from DNS responses? How about decreasing the number of actual files referenced? or minify and compress them?
Take a look at webassets, or a particular package for your framework: Flask-Assets, django-compressor, django-htmlmin, and pyramid-htmlmin. Mozilla also has more tips for fast-loading HTML pages.
Chunked Responses #
Can you use chunked encoding when returning large amounts of data? Or can you otherwise have your services produce elements of the response as they are needed, rather than trying to produce all elements as fast as possible? Have a look at Flask’s docs on streaming responses, peek at how Pyramid supports streaming responses with app_iter or Django’s StreamingHttpResponse, or get inspiration from aiohttp’s implementation.
Tracing Frameworks, Systems, and Services #
Frameworks #
OpenTracing #
Impressively, there is an open standard for distributed tracing – OpenTracing – allowing developers of applications, or open source packages, or services, from nginx to ORMs, to instrument their code without vendor lock-in. And they do this by standardizing trace span APIs.
One criticism of OpenTracing is there is no prescribed way to implement more intelligent sampling other than a simple percentage and setting priority. There’s also a lack of standardization for how to track relationships, whether submitter or trigger based. It’s mainly just a standardization for managing a span of a trace itself. But mind you, it’s still a very young specification that’s evolving and developing.
Some OpenTracing Python libraries to instrument your applications and are tracing-implementation agnostic: opentracing-python, flask-opentracing, and django-opentracing.
OpenCensus #
OpenCensus is an open source project from Google (blog post of release), released at the beginning of this year, and defines itself as more of observability framework, not just tracing. There’s a lot of overlap between OpenTracing and OpenCensus in terms of use case & purpose, but they’re different in terms of API philosophy and approach (a good GitHub issue conversation on the differences).
Both OpenTracing and OpenCensus define an API for working with traces and spans, and both include language-specific client libraries.
Although one noticeable difference is that OpenCensus publishes a standard library of sorts for each language, as opposed to the clients available for OpenTracing being distributed across various repos and therefore owners.
OpenCensus is also a bit broader in scope, as described a bit here. It not only defines an API for tracing, but also includes a defined API for the collection & exporting of metrics.
A subtle but significant difference is that OpenTracing encourages the use of its tracing api for logging, metrics, tag propagation in addition to tracing; basically a one-size-fits-all. For example, you’d be forced to use the concept of tracing spans within OpenTracing’s logging API.
OpenCensus on the other hand decouples those purposes and has separate APIs for each. It allows for a bit more flexibility in terms of appropriateness for different use cases and dependency management.
Self-Hosted Systems #
And there are a few self hosted, popular solutions out there that support both OpenTracing and OpenCensus:
Zipkin (Twitter) #
Probably the most widely used is Zipkin, from Twitter, which has implementations in Java, Go, JavaScript, Ruby, and Scala. The architecture setup is basically the instrumented app sends data out of band to a remote collector that accepts a few different transport mechanisms, including HTTP, Kafka, and Scribe. With propagating data around, all of the current Python client libraries (py_zipkin, pyramid_zipkin, swagger_zipkin, and flask-zipkin) only support HTTP – no RPC support.
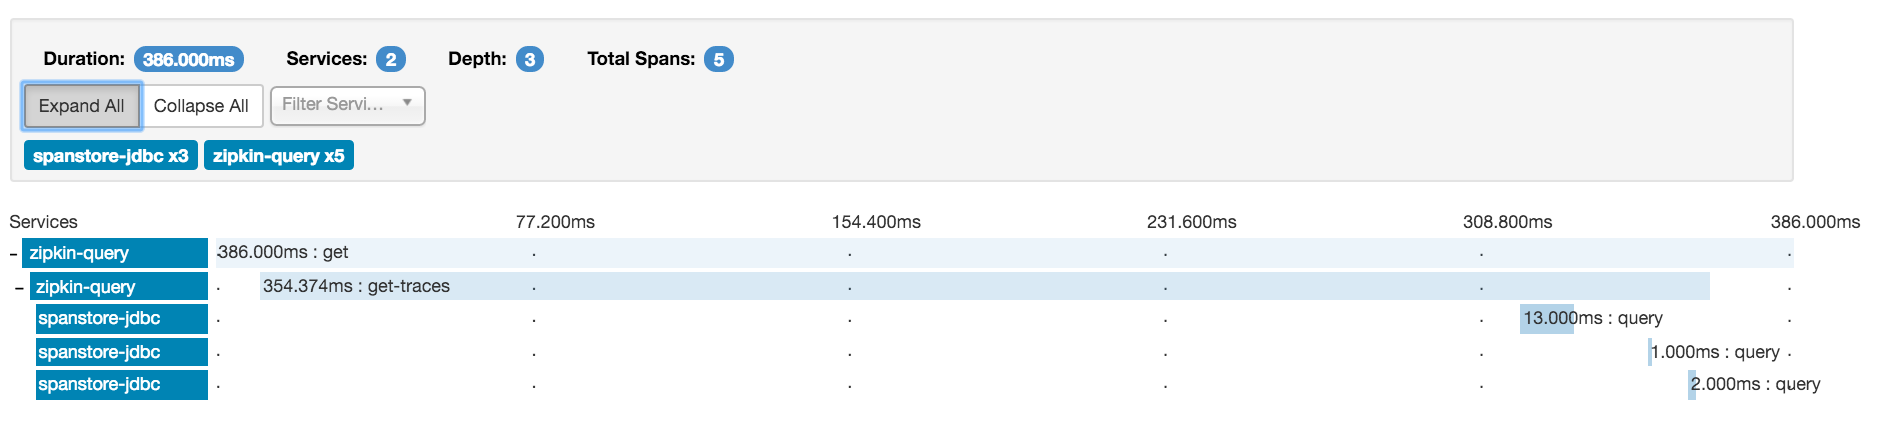
And finally, Zipkin does provide a nice Gantt chart of individual traces, and you can view a tree of dependencies, but it’s essentially only a context calling tree with no information as to latencies, status codes, or anything else.
An example to show how much instrumentation is needed when using py_zipkin:
# app.py

import requests

from flask import Flask
from py_zipkin.zipkin import zipkin_span

ZIPKIN_HOST = "10.0.0.1"
ZIPKIN_PORT = "9411"
APP_PORT = 5000

app = Flask(__name__)
app.config.update({
    ZIPKIN_HOST="10.0.0.1",
    ZIPKIN_PORT="9411",
    APP_PORT=5000,
    # any other app config-y things
})


def http_transport(encoded_span):
    # encoding prefix explained in https://github.com/Yelp/py_zipkin#transport
    body = b"\x0c\x00\x00\x00\x01" + encoded_span
    zipkin_url = "http://{host}:{port}/api/v1/spans".format(
        host=app.config["ZIPKIN_HOST"], port=app.config["ZIPKIN_PORT"])
    headers = {"Content-Type": "application/x-thrift"}

    # You'd probably want to wrap this in a try/except in case POSTing fails
    requests.post(zipkin_url, data=body, headers=headers)


@app.route("/")
def index():
    kwargs = {
        # name of the service, app, or otherwise overall component
        service_name="myawesomeapp",
        # name of the individual trace point, e.g. function name itself
        span_name="index",
        # must define a transport handler like above (or one for Kafka or Scribe)
        transport_handler=http_transport,
        # the port (int) on which your service/app/component runs
        port=app.config["APP_PORT"],
        # Sample rate (int) from 0 to 100; use 100 to always trace
        sample_rate=100
    }
    with zipkin_span(**kwargs):
        some_other_func()
        # app logic


# add a span to the trace that was started above
@zipkin_span(service_name="myawesomeapp", span_name="some_other_func")
def some_other_func():
    # other app logic
Using py_zipkin, on which other libraries are based, you need to define a transport mechanism, which can be just a simple post request with the content. You can otherwise define a Kafka or Scribe transport. But then it’s just a simple context manager placed wherever you want to start a trace, and a simple decorator to add spans to a trace. There’s also sample code to add a tween to Pyramid.
Jaeger (Uber) #
Jaeger is another self-hosted tracing system that supports the OpenTracing specification that comes from Uber. Rather than the application/client library reporting to a remote collector, it reports to a local agent via UDP, who then sends traces to a collector. Also unlike Zipkin, which supports Cassandra, ElasticSearch, and MySQL, Jaeger only supports Cassandra for its trace storage.
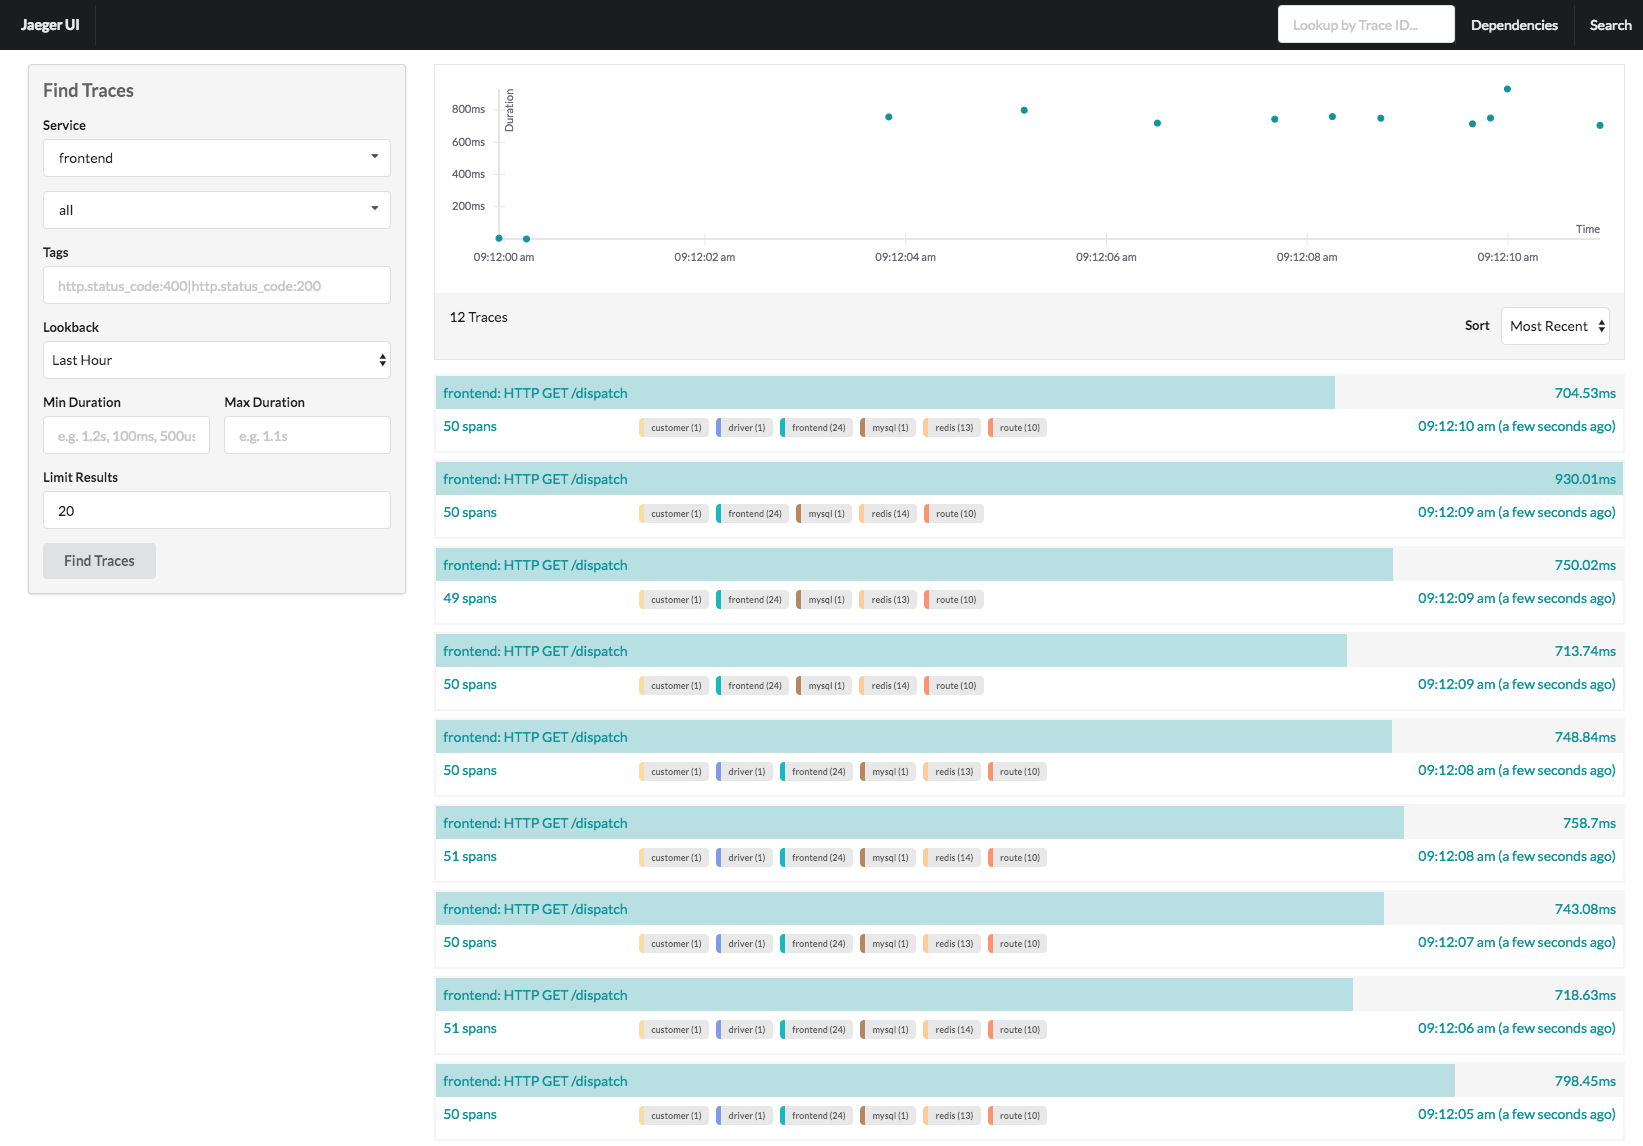
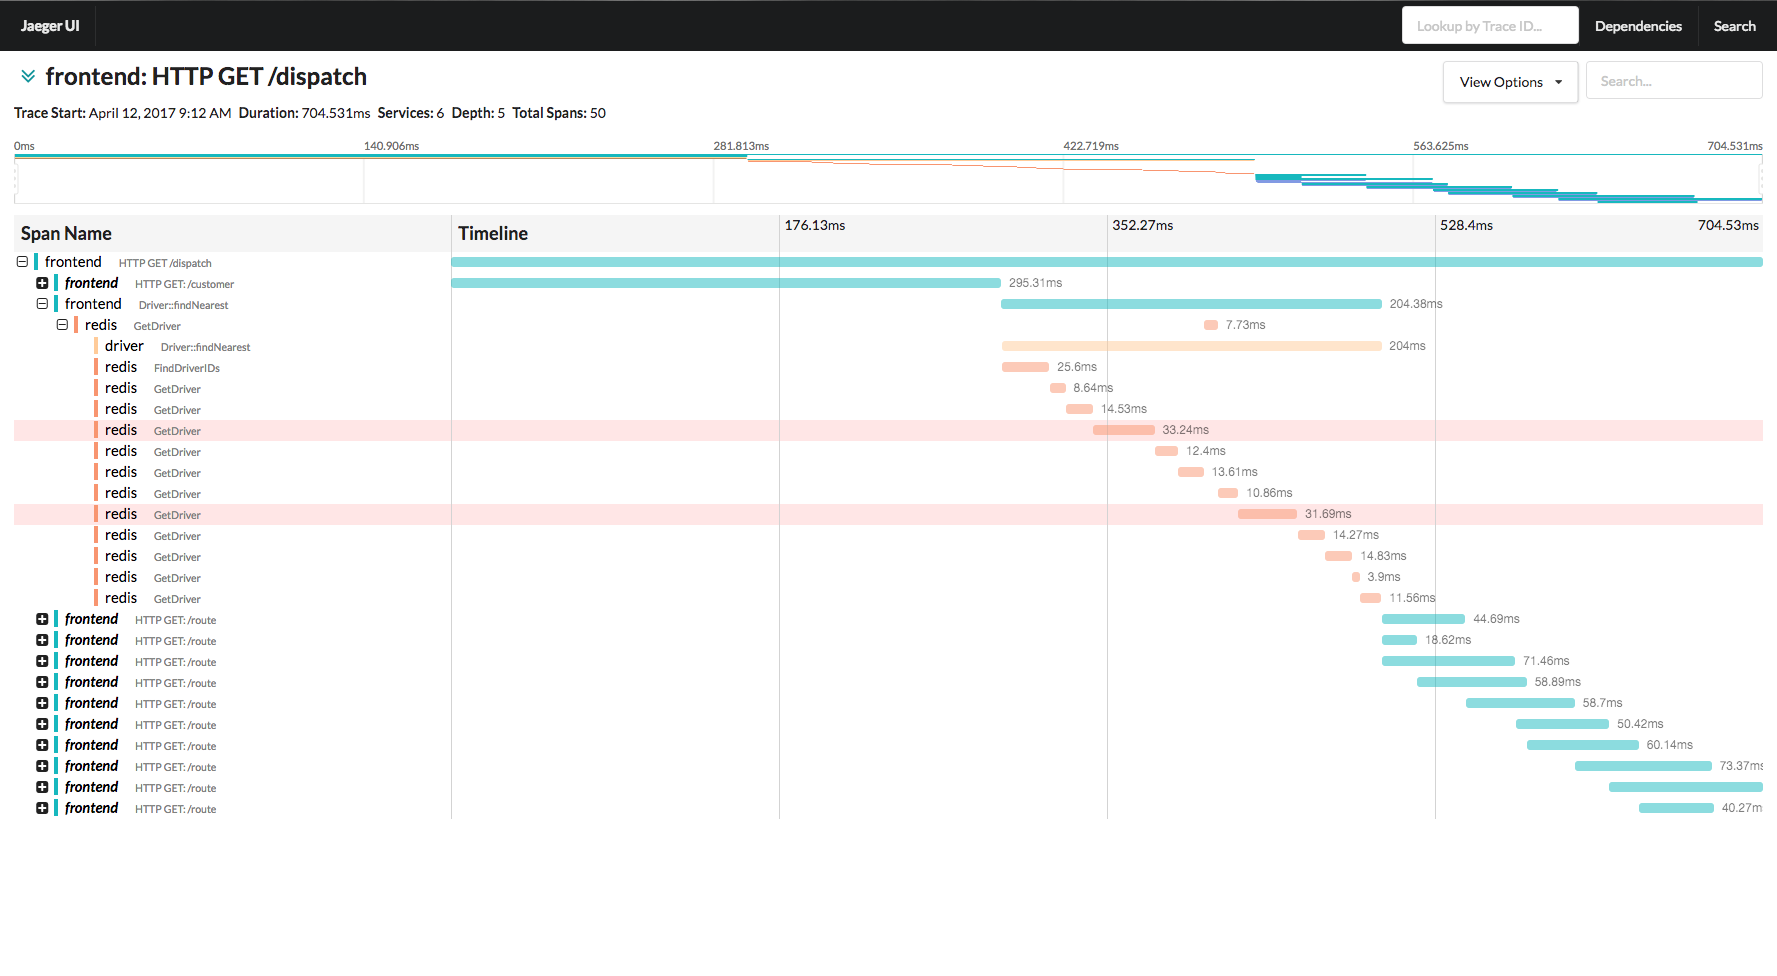
However, the UI is very similar to Zipkin with pretty waterfall graphs and a dependency tree, but again, nothing that can easily help aggregate performance information. Their documentation is also lacking; but they do have a pretty decent tutorial to walk through.
Their Python client library is a bit cringe-worthy, taken from their README example:
# app.py

import logging
import time

import opentracing as ot

from flask import Flask
from jaeger_client import Config


# Adapted from jaeger-client-python README at
# https://github.com/uber/jaeger-client-python#getting-started
app = Flask(__name__)
app.config.update({
    "JAEGER_SAMPLE_TYPE": "const",
    "JAEGER_SAMPLE_PARAM": 1,
    "JAEGER_LOGGING": True,
    "LOG_LEVEL": logging.DEBUG,
    # any other app config-y things
})
logging.getLogger("").handlers = []
logging.basicConfig(format="%(asctime)s %(message)s", level=app.config["LOG_LEVEL"])
config = Config(
    config={
        "sampler": {
            "type": app.config["JAEGER_SAMPLE_TYPE"],
            "param": app.config["JAEGER_SAMPLE_PARAM"],
        },
        "logging": True,
    },
    service_name="myawesomeapp"
)
tracer = config.initialize_tracer()

@app.route("/")
def index():
    with ot.tracer.start_span("Index") as span:
        span.log_event("test message", payload={"life": 42})

        with ot.tracer.start_span("IndexChild", child_of=span) as child_span:
            # NB: the README linked above says `span.log_event`, but
            # they might have meant `child_span.log_event`
            span.log_event("another test message")

# wat
time.sleep(2)   # yield to IOLoop to flush the spans
tracer.close()  # flush any buffered spans
This is an adapted example from their docs that’s made to use with a Flask app. Basically you initialize a tracer that the OpenTracing Python library will use, and create spans and child spans with context managers.
But their usage of time.sleep for yielding to IOLoop is a bit of a head scratcher. It’s docs also make mention of support for monkeypatching libraries like requests, and redis, and urllib2. So, all I can say is, use at your own risk.
Update: Days after this talk was given at PyCon 2017, they have updated their README.md that documents the reason for time.sleep.
Honorable Mentions #
There aren’t that many other self-hosted, open source solutions out there. At the time of writing, there is AppDash which is based on Google’s Dapper as well as Zipkin. And a few more backends for OpenTracing and OpenCensus with no python client libraries (yet). But do know that this a fast growing area, so I’d imagine more support for Python is coming.
Tracing Services #
In case you don’t want to host your own system, there are a few services out there to help.
Stackdriver Trace (Google) #
There is Stackdriver Trace from Google (not to be confused with Stackdriver Logging) that’s pretty promising. With the release of OpenCensus and its client libraries, Stackdriver has added support for Python and gRPC (both which didn’t exist when this post was originally written)
They also support Zipkin traces, where you can setup a Google-flavored Zipkin server, either on their infrastructure or on yours, and have it forward traces to Stackdriver. They actually make it pretty easy: I was able to spin up their Docker image on Compute Engine and start viewing traces of my sample app within a couple of minutes.
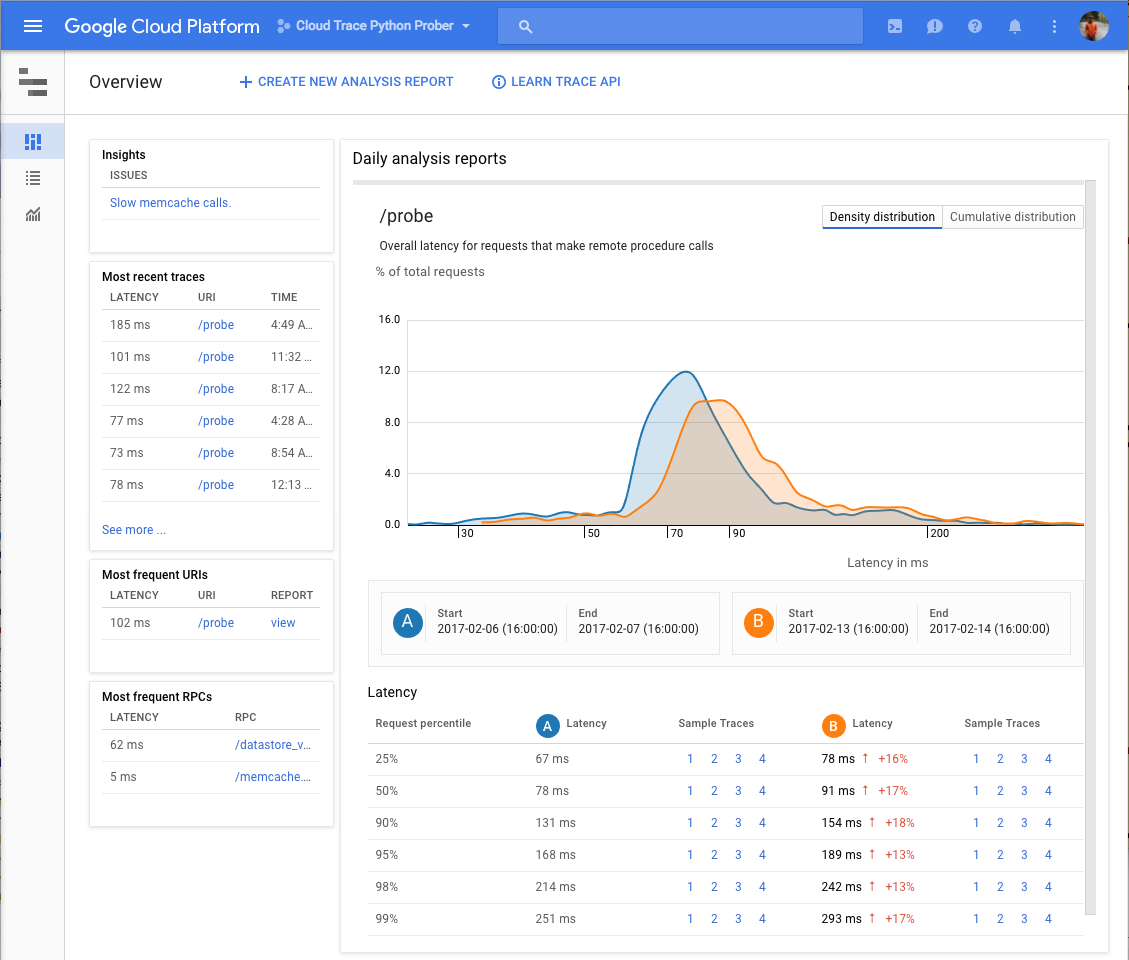
A couple of annoyances: simple plots of response time over the past few hours and a list of all traces are automatically provided in Stackdriver’s UI. However, you have to manually make “analysis reports” for each time period you’re interested in to get fancy distribution graphs; they’re not automatically generated. It also may be annoying that trace storage is limited to 30 days – same with their Stackdriver logging.
X-Ray (AWS) #
Amazon also has a tracing service available called X-Ray. Interestingly, it does support OpenCensus but not OpenTracing. Within the last year, they’ve added support for Python with their X-Ray SDK which takes care of pushing metrics to a local, daemonized collector. When I first looked at X-Ray, they only had first class SDK support for Node, Java, and .NET apps.
What’s nice about X-Ray is you’re able to configure sampling rates based on different dimensions, e.g. service types like EC2 or Beanstock; different URL routes or HTTP methods of your application; and any self-defined key/value pair, among others.
X-Ray has the best visualizations available, in my opinion. While there is the typical waterfall chart, they also have a request flow graph where you can see average latencies, captured traces per minute, and requests broken down by response status.
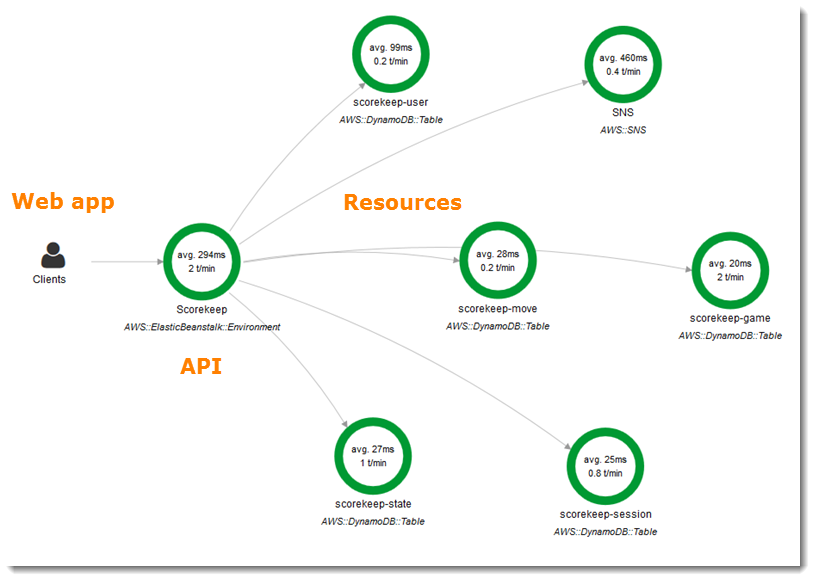
Another cool tidbit is you’re able to send your traces from outside of the AWS environment to the X-Ray service. They’ve open sourced their daemon, which is the intermediary between an app instrumented with their SDK, and the X-Ray backend. So you’re able to setup a daemon elsewhere – whether on some physical hosts, or another cloud provider – and make use of their sampling features and visualizations.
When this post was first written, AWS lacked Python support, had no support any open API, nor have a way to send metrics from outside the AWS ecosystem. I am so happy that they’ve developed this product more because they have the most flexibility with sampling and probably the most useful visualizations compared to the other options I’ve mentioned above.
Honorable Mentions #
A couple of honorable mentions that do app performance measurement: Datadog, New Relic, and LightStep. I don’t have experience with these services for this problem space, but they certainly provide helpful tools for tracing across applications.
TL;DR #
You need this. If you run microservices, you should be tracing them. It’s otherwise very difficult to understand an entire system’s performance, anomalistic behavior, resource usage, among many other aspects.
However, good luck with that. Whether you choose a self- hosted solution or a provided service, documentation is all-around lacking. Granted, it’s still a very young space, very much growing as the OpenTracing standard is developing.
Language support for Python is improving, and has made great strides in the past year. Across available backends, there’s still a lack of configuration for relationship tracking, intelligent sampling, and available visualizations, particularly in the self-hosted space. But, there are two open specifications that can be influenced, or use to implement your own – if you’re so inclined.
Further Reading #
With respect to global synchronization, I think it’d be pretty interesting to use Merkle trees in place of logical clocks. A relevant white paper I found: “Merkle Hash Trees for Distributed Audit Logs” by Karthikeyan Bhargavan.
Posts from various companies:
- “Distributed tracing at Pinterest with new open source tools” by Suman Karumuri
- “Distributed tracing at Yelp” by Prateek A.
- “Real-time distributed tracing for website performance and efficiency optimizations” by Chris Coleman & Toon Sripatanaskul (LinkedIn)
- “Distributed Systems Tracing with Zipkin” by @cra (Twitter)
Footnotes #
nb: I had personal difficulty properly citing everything within this blog post as it’s a digestion and an amalgamation of a few different papers, all smushed together. This is not exactly following the Chicago Manual of Style for citations (with the linking and absence of a proper bibliography) as I’m prefer ease for the reader for this non-scientific blog post.